Now Reading: Ad Reporting
-
01
Ad Reporting

The more data you collect on your ad campaigns, the more you can connect with your target audience.
Your Ads Manager dashboard enables you to view your campaign performance as soon as your ads start to run. You can see an overview of the whole campaign or elect to see breakdowns by ad set, ad, placement and more.
You can also view results across different date ranges and choose the columns that you want to see in your dashboard. If you like, you can export table data or navigate through to Ads Reporting to build a custom report.
Ads Manager also has an app for iOS or Android, which you can install on your mobile device and use to monitor your campaign performance.
Access your campaign data
In Ads Manager, you can view all current and past campaigns in your account.
Your overview dashboard shows key metrics about each campaign. You can elect to display the information that is most important to you.
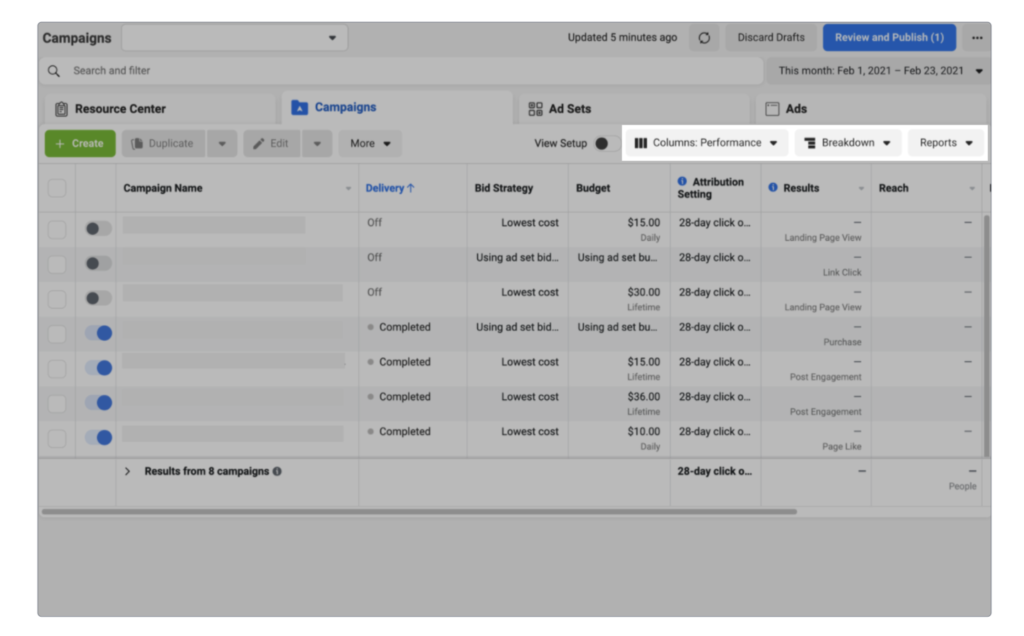 Columns: Customize the columns on screen to view metrics for performance, engagement, delivery and more.
Breakdowns: View your results by time period, delivery type or audience action. Please note, delivery and action breakdowns, such as age, gender, region, and placement are not supported for iOS 14 app install campaigns due to the aggregated nature of SKAdNetwork API data.
Reports: Export data as a spreadsheet or a CSV file, or display your data in one of the standard reports. Standard reports open in Ads Reporting, which is a separate tool.
–
Mid-campaign reporting
We recommend that you check your Ads Manager dashboard throughout your campaign to confirm that you’re getting the results you expect.
Here are some suggestions for metrics you can use to monitor your campaigns while they run.
Post-campaign reporting
Export report data:
At the end of your campaign, you can review your Ads Manager data against your own business data to determine whether your campaign met your business goals.
You can export report data to use in your own business reporting tools or analyze your results in Ads Reporting. Ads Reporting is a separate tool with advanced reporting capabilities, where you can create custom metrics and custom breakdowns and save and schedule your own custom reports.
Your campaign results show which placements, audiences and creative delivered the best results, so you can use them to identify ways to optimize future campaigns.

Objectives and results:
The objective you choose determines which results or metrics you use to understand your campaign performance. For example, if your goal is to increase the number of people who visit your website but you choose the engagement objective, you may be surprised to see a high number of Page likes but no link clicks. You should have therefore chosen the traffic objective instead.
Each objective is intended to help you achieve a specific result so if your campaign performs well in an unexpected metric, assess whether your objective is aligned with the result you want to see.
Related Posts


Stay Informed With the Latest & Most Important News
Previous Post
Next Post


Advertisement